
This webpage from iaa.csic.es is no more maintained and kept for historical purpose only. Please click HERE to browse the new PANIC webpages at caha.es for the camera updated with a new 4K sensor
Instrument
Detectors
The detector used in PANIC is a mosaic of 4 Hawaii-2RG detectors which are mounted in one module so the full mosaic has 4096x4096 pixel with a gap between the individual detectors of 167 pixels (1pixel=18um).
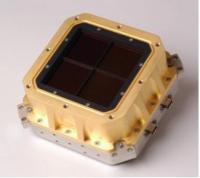 |
Next table shows typical basic characteristics of the detectors:
| Quantum efficiency |
J-band H-band K-band |
0.64 0.79 0.76 |
|---|---|---|
| Full-well capacity | 260000 e- | |
| Conversion factor | 4.8 e-/ADU | |
| Readout Noise (RON) |
standard readout Fowler readout |
18 e- 5 e- |
Readout modes
Best cosmetics is obtained with the lir-mode (line-interlaced read with embedded line-resets). Note that with this mode the minimun exposure time DIT is 2.63s.
You can find a detailed description of each readout mode available for the detectors on this document.
Linearity
HAWAII-2RG near-IR detectors exhibit an inherent non-linear response. It is caused by the change of the applied reverse bias voltage due to the accumulation of generated charge. The effect increases with signal levels, so that the measured signal deviates stronger from the incident photon number at higher levels, and eventually levels out when the pixel well reaches saturation.
For more details, see next document.
Filters
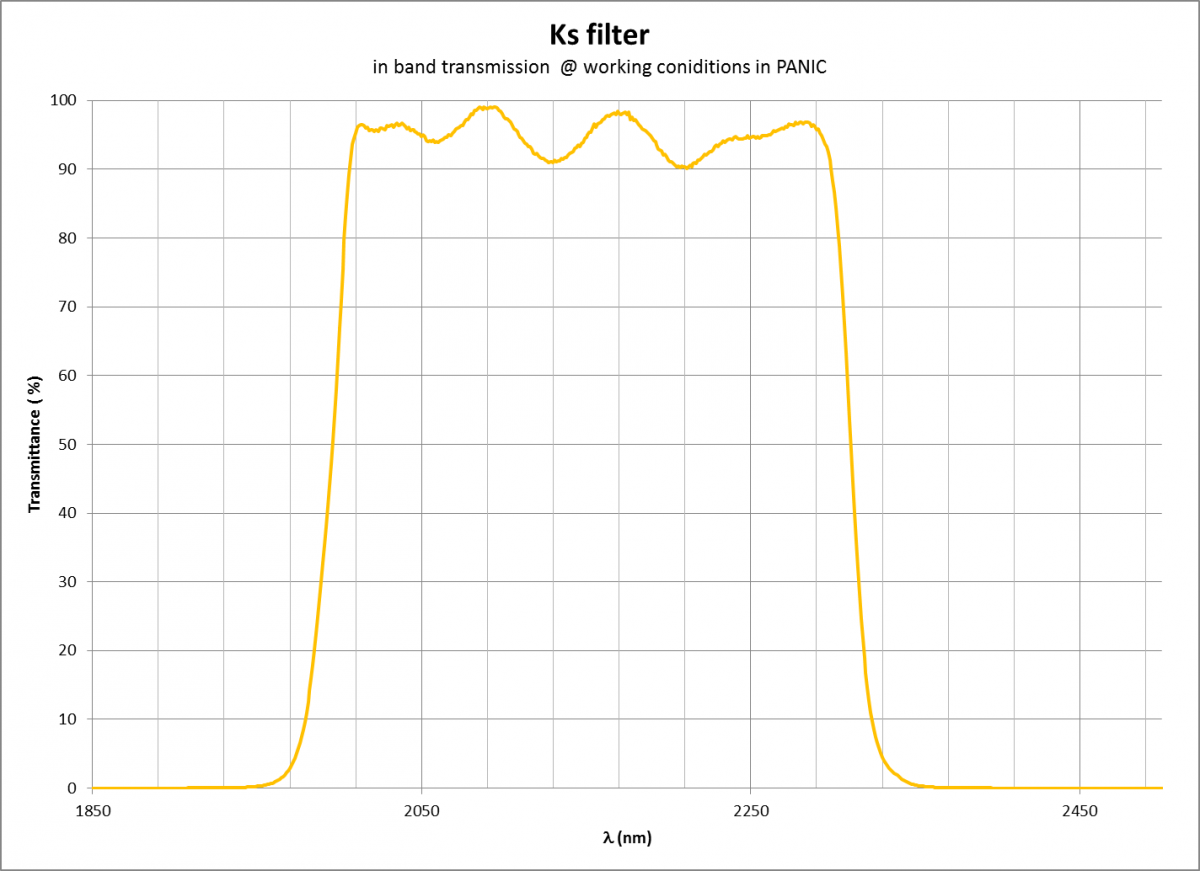
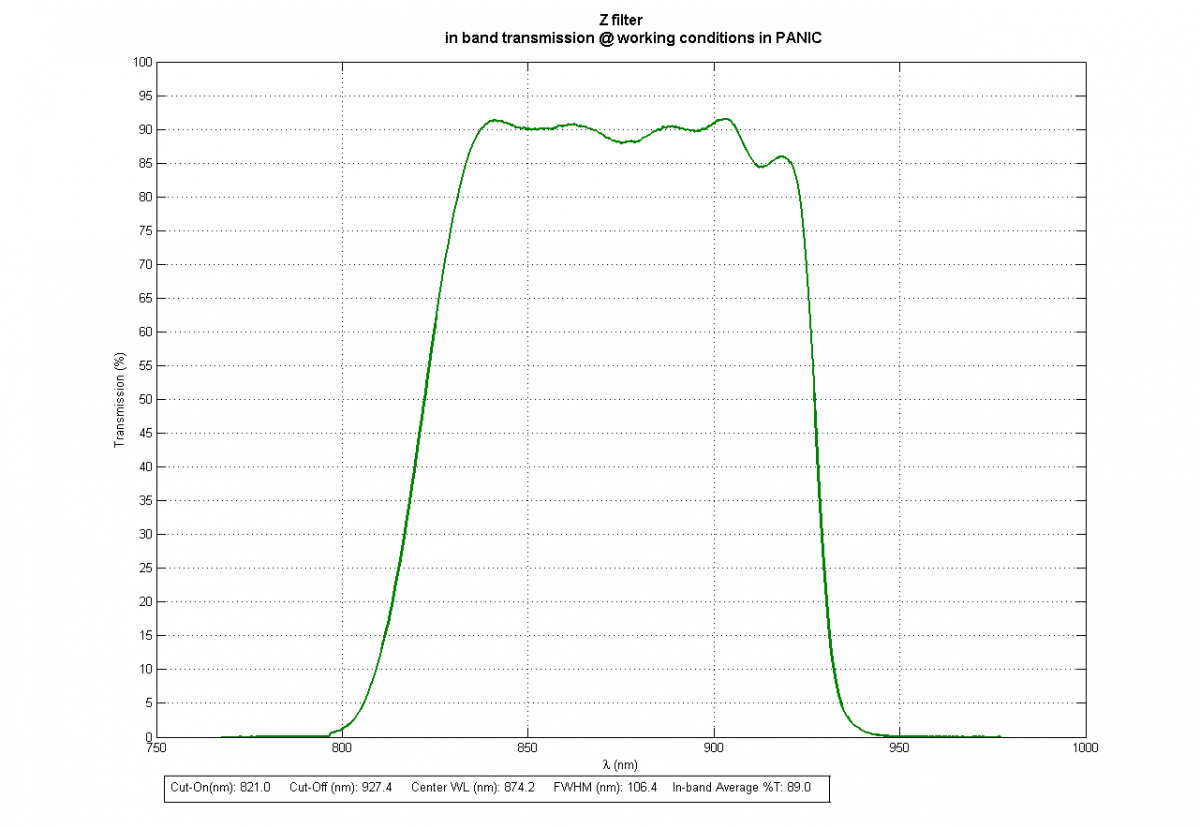
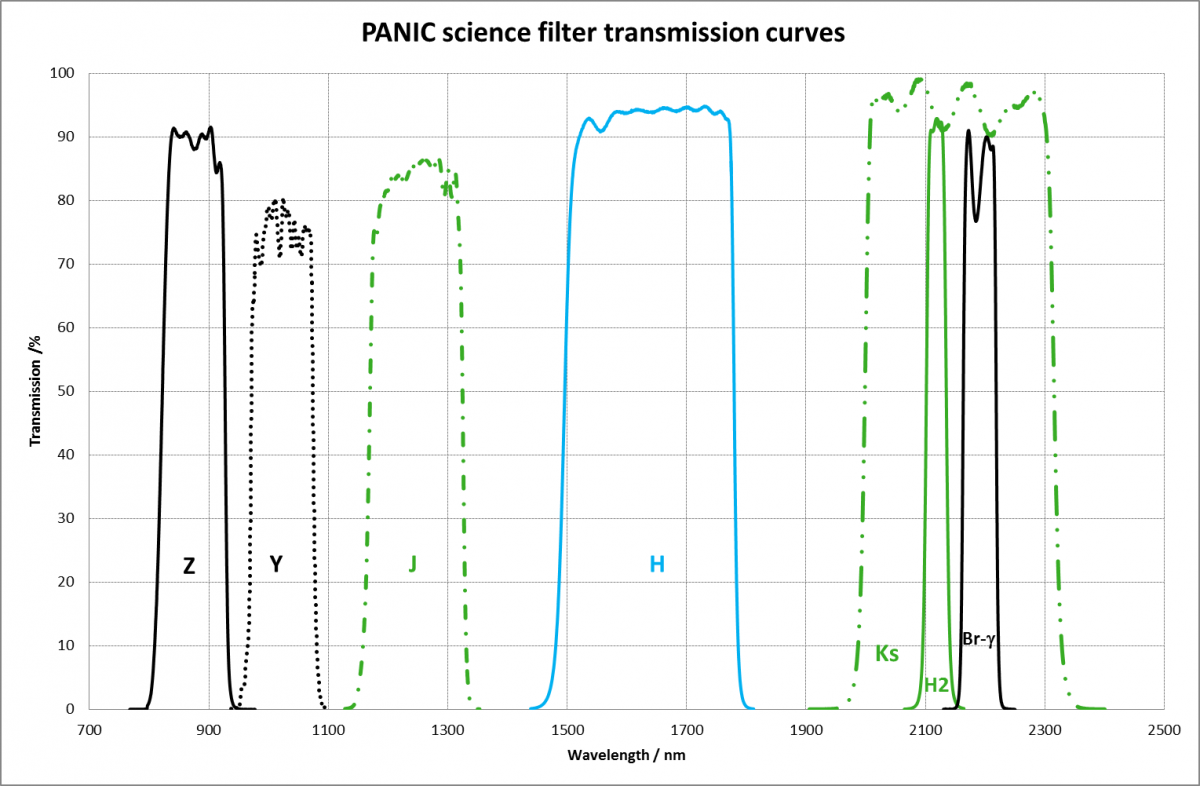
Standard broad band filters offered for PANIC.
Remarks:
- The filter parameters are at the working conditions (100 K and converging beam).
- The filters are located in a converging beam. It is not possible to combine two filters on different wheels.
- FWHM means, Full Width Half Maximum
- All lambdas values are in microns.
| Filter | Central wavelength | FWHM | 50% cut-on | 50% cut-off | T |
|---|---|---|---|---|---|
| Z | 0.874 | 0.106 | 0.821 | 0.927 | 85% |
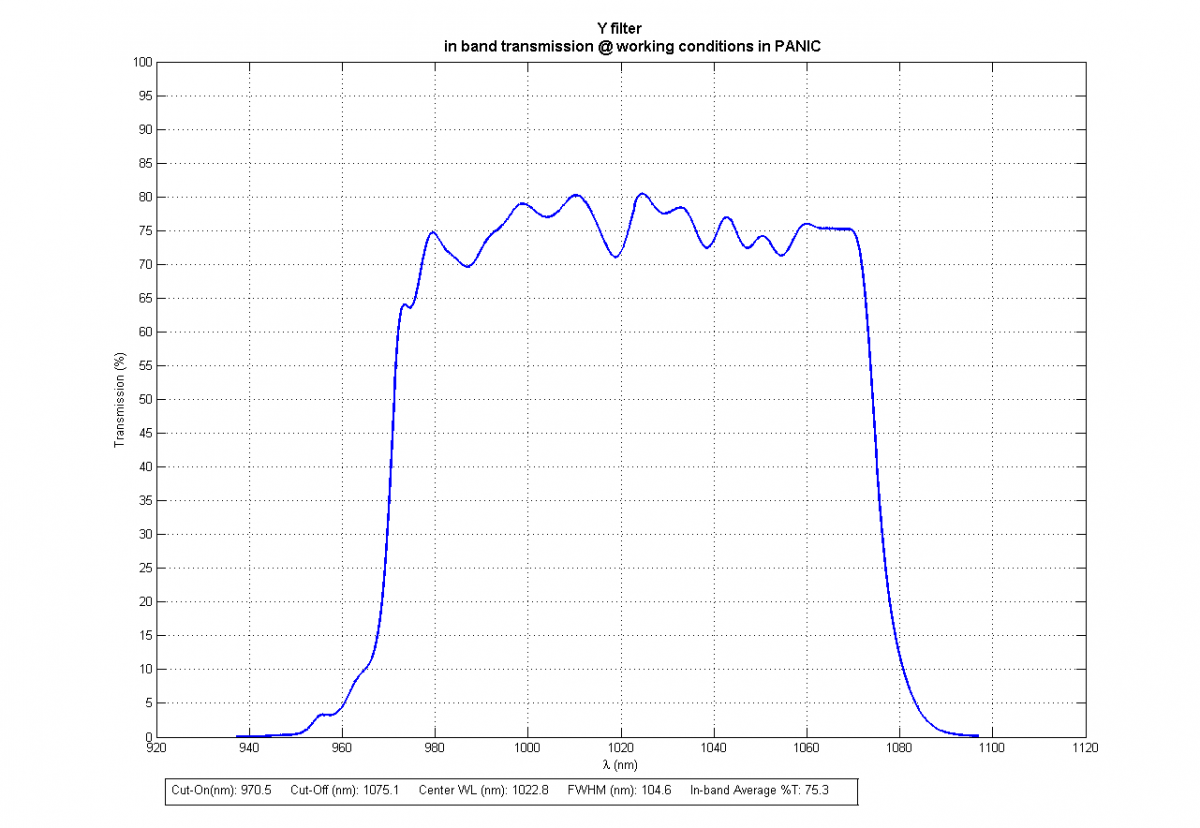
| Y | 1.023 | 0.105 | 0.971 | 1.075 | 75% |
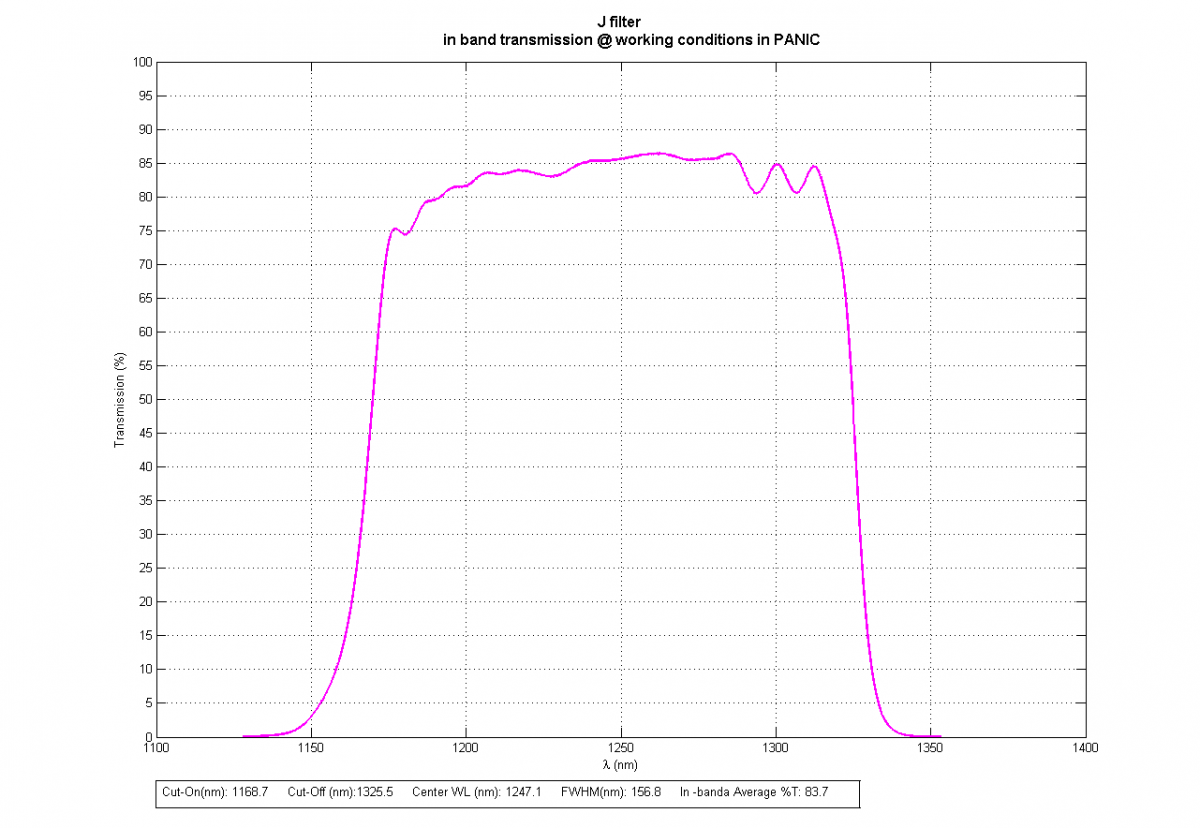
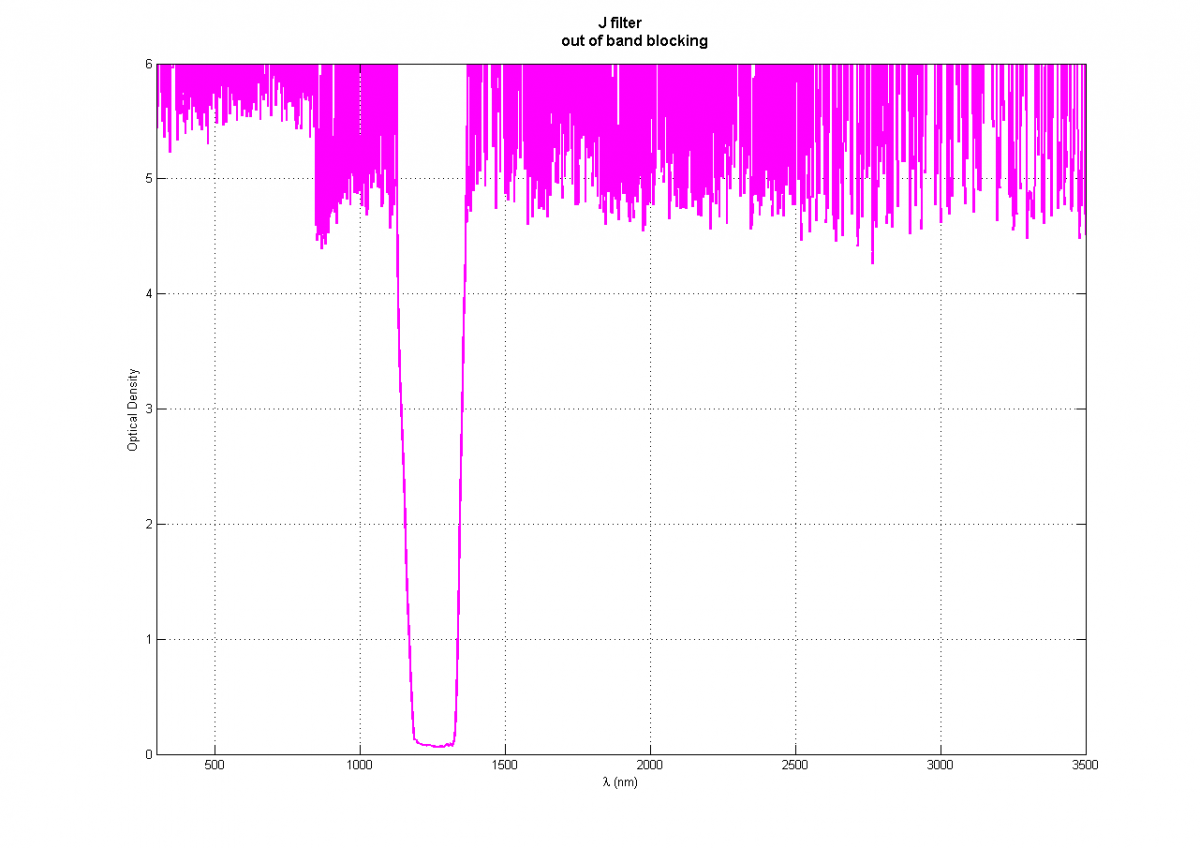
| J | 1.247 | 0.157 | 1.169 | 1.326 | 84% |
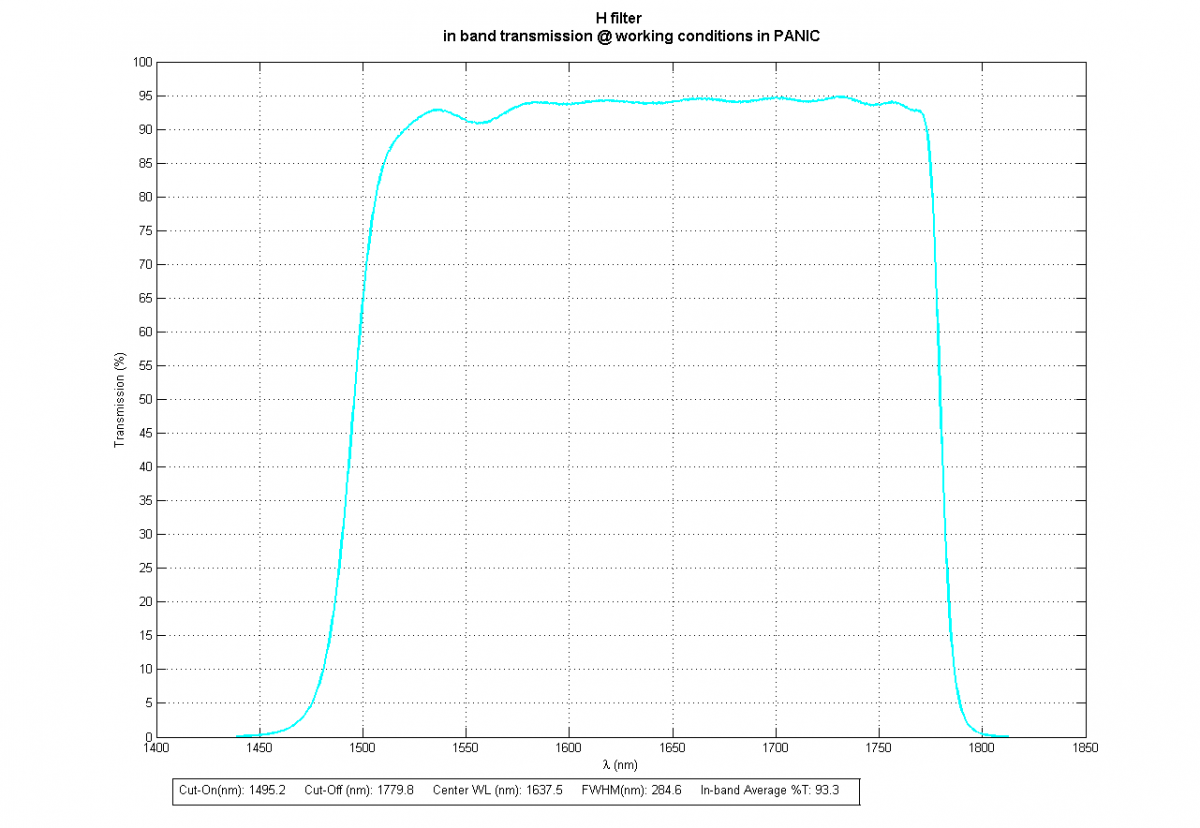
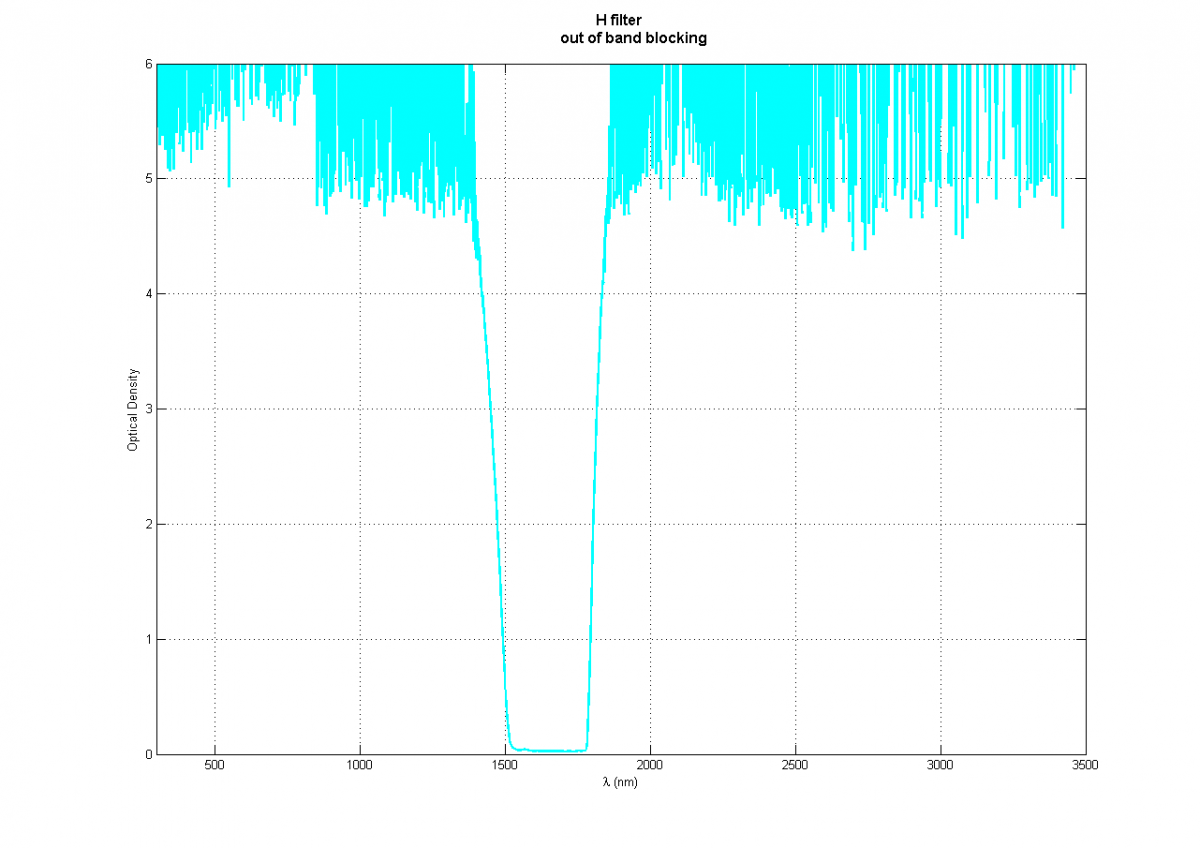
| H | 1.638 | 0.285 | 1.495 | 1.780 | 93% |
| Ks | 2.150 | 0.328 | 1.986 | 2.314 | 95% |
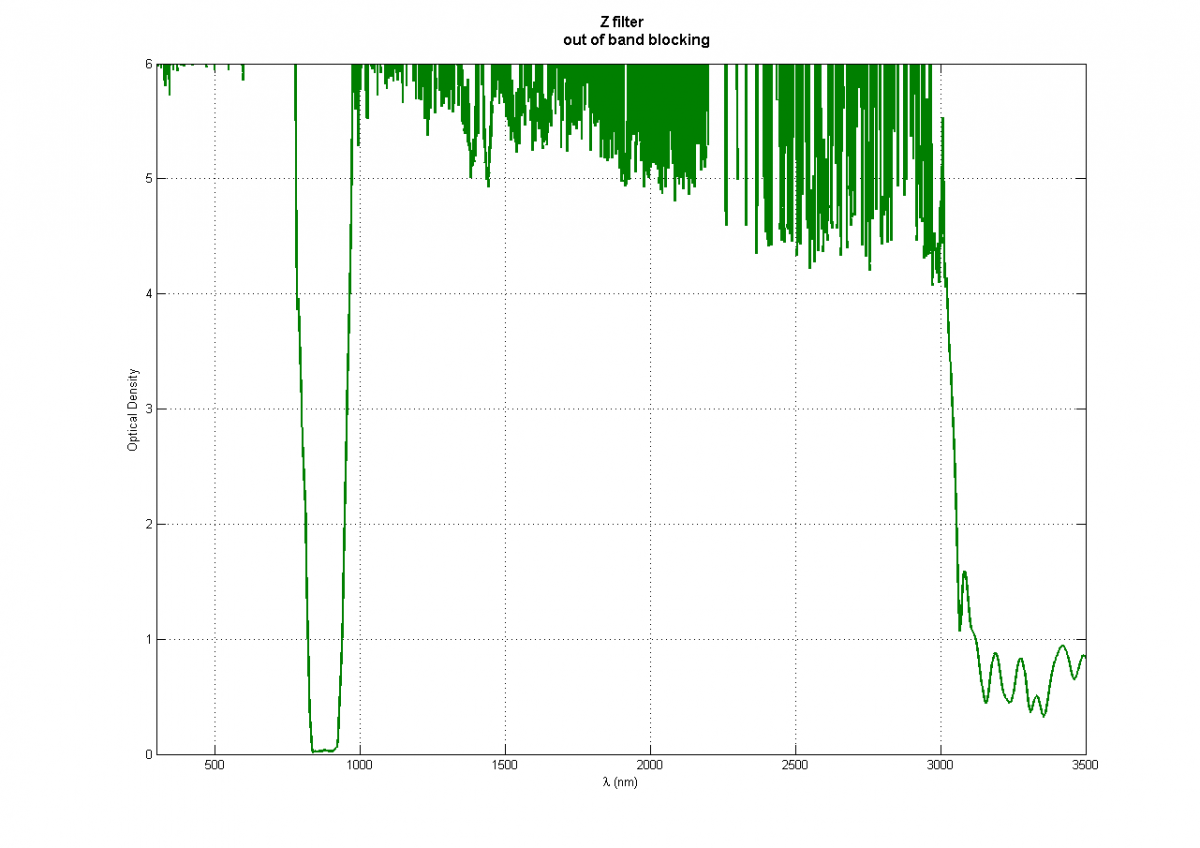
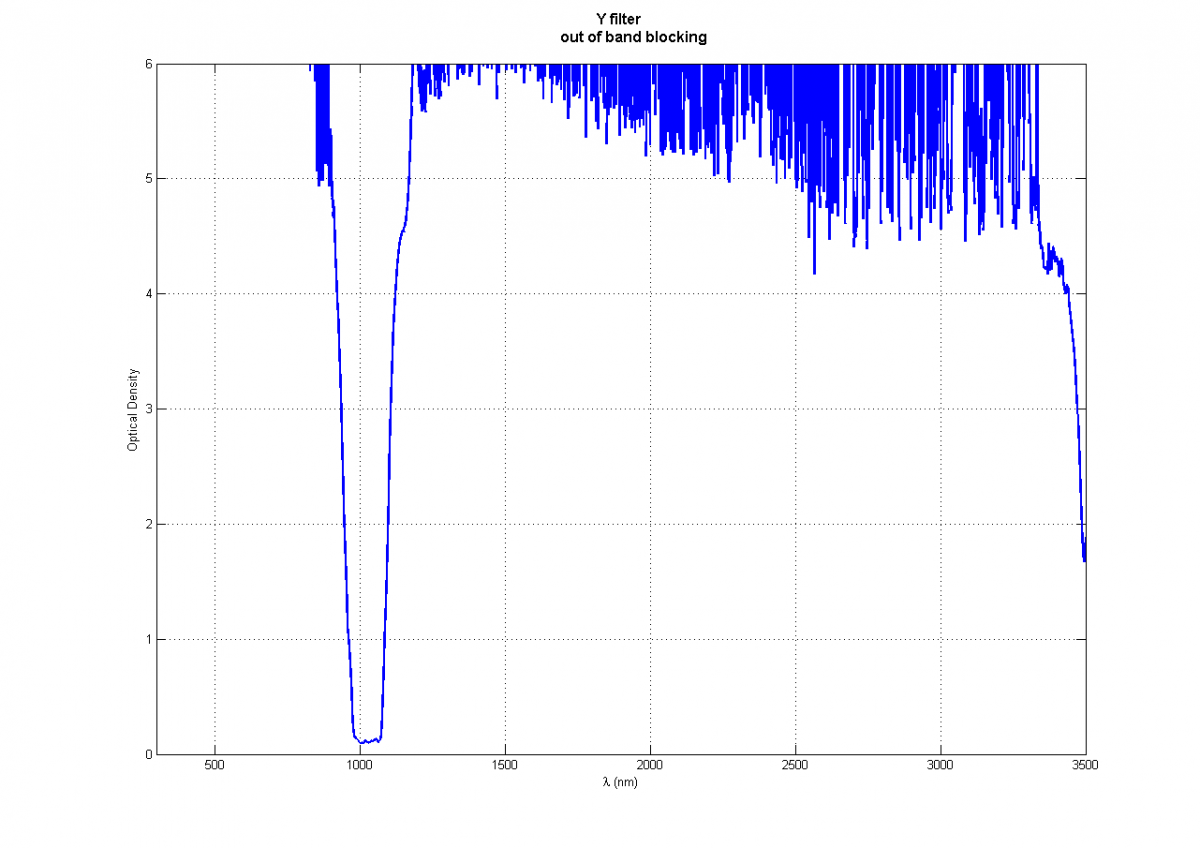
| Filter | Transmision plot | Transmission ascii data | Out out band blocking plot | Out of band blocking ascii data |
|---|---|---|---|---|
| Z | plot_Z | ascii_Z | plot_out_Z | ascii_out_Z |
| Y | plot_Y | ascii_Y | plot_out_Y | ascii_out_Y |
| J | plot_J | ascii_J | plot_out_J | ascii_out_J |
| H | plot_H | ascii_H | plot_out_H | ascii_out_H |
| Ks | plot_Ks | ascii_Ks | plot_out_Ks | ascii_out_Ks |
 |
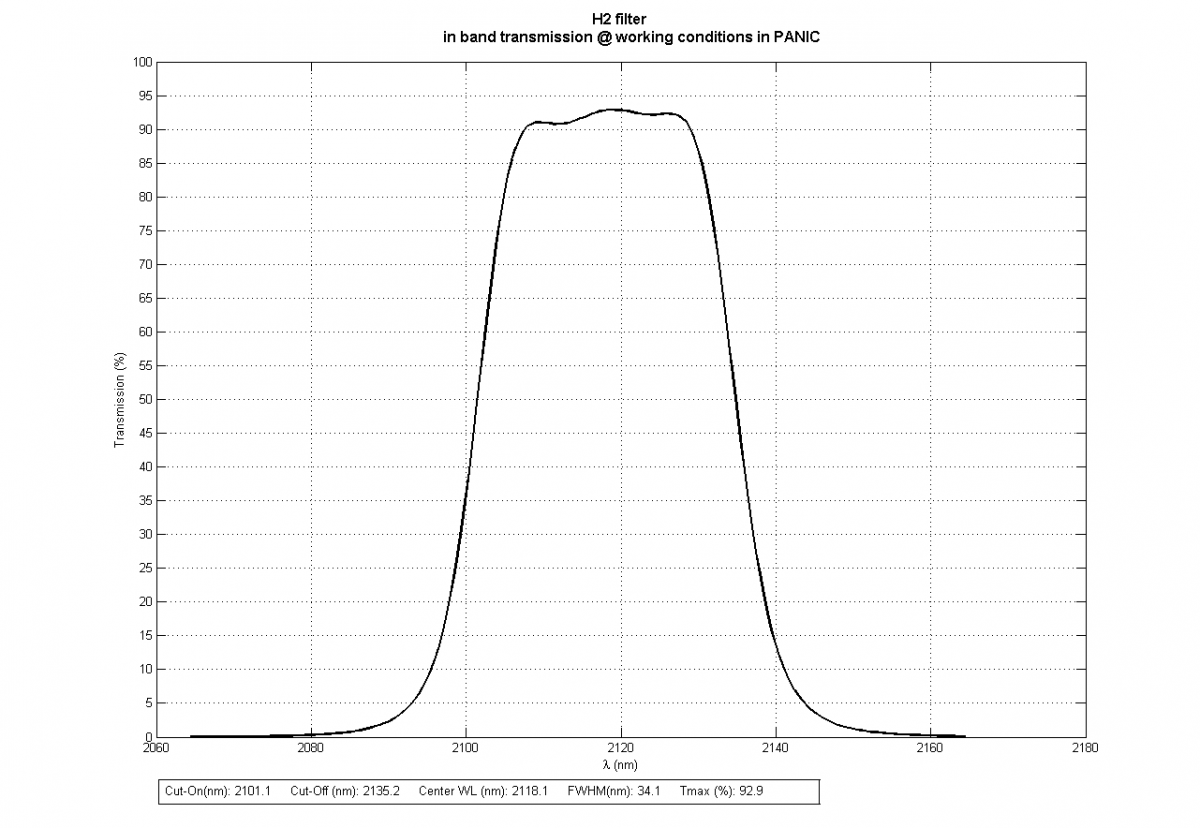
Standard narrow band filter
| Filter | Central wavelength | FWHM | 50% cut-on | 50% cut-off | T |
|---|---|---|---|---|---|
| Br-gamma | 2.191 | 0.055 | 2.163 | 2.218 | 83% |
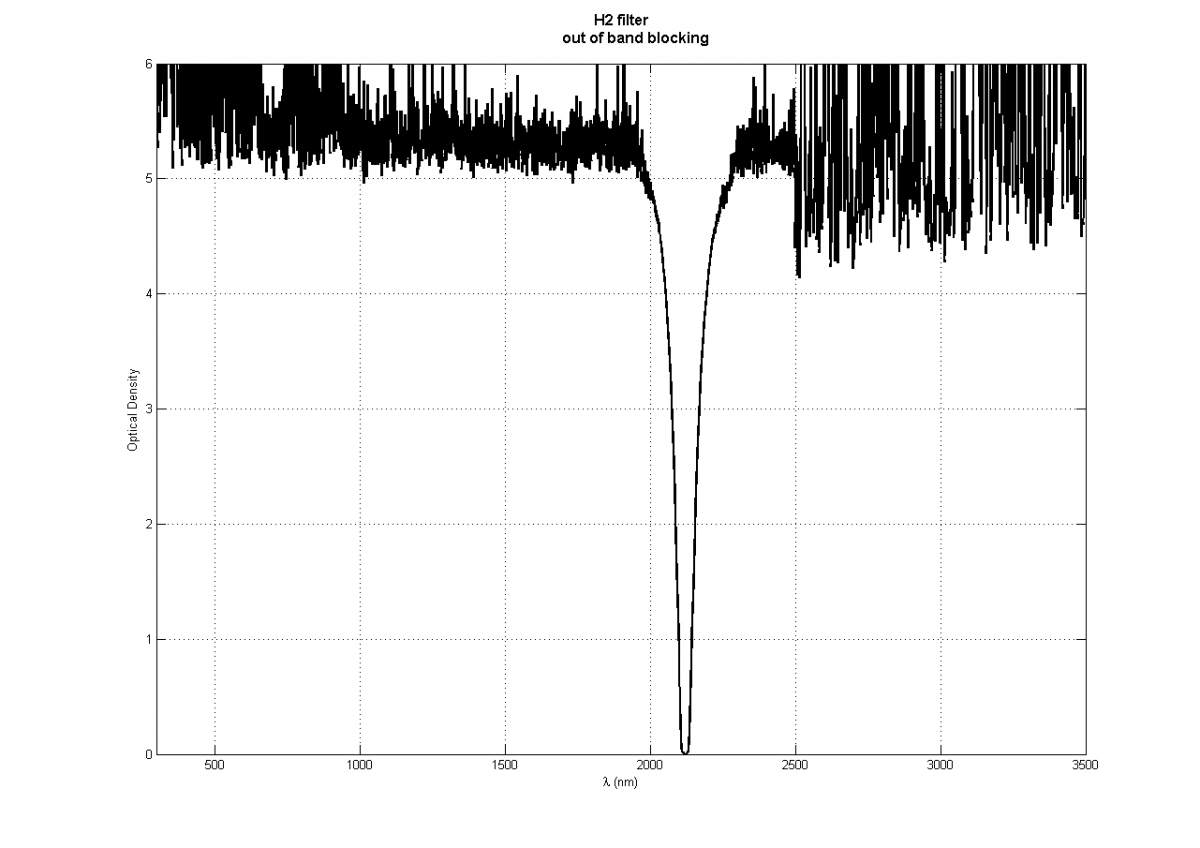
| H2 | 2.118 | 0.034 | 2.101 | 2.135 | 93% |
| Filter | Transmision plot | Transmission ascii data | Out out band blocking plot | Out of band blocking ascii data |
|---|---|---|---|---|
| Br-gamma | plot_Br-g | ascii_Br-g | plot_out_Br-g | ascii_out_Br-g |
| H2 | plot_H2 | ascii_H2 | plot_out_H2 | ascii_out_H2 |
Custom filters
- PANIC can be equipped with a total of 15 filters (24 - 4 blanks - 4 Open - 1 PIL = 15), and currently is equipped with 7 filters (see above). Thus, the filters wheels can accommodate a further 8 filters.
- Specifications for designing custom filters can be taken from this document.
Narrow band filters
The optical design of PANIC allows the use of narrow band filters, i.e. filters for which the bandwidth is equal to 1% of central wavelength.
Latest News
| Title |
Date |
|---|---|
| First PANIC results: A startburst reveals the formation mechanism of massive stars | 14-Nov-2016 |
| First Light | 06-Nov-2014 |
| AIV in good progress | 18-Jul-2013 |
| Laboratory performance tests | 12-Nov-2012 |
| First software integration tests | 16-Dec-2011 |
- ‹ previous
- 2 of 4
- next ›